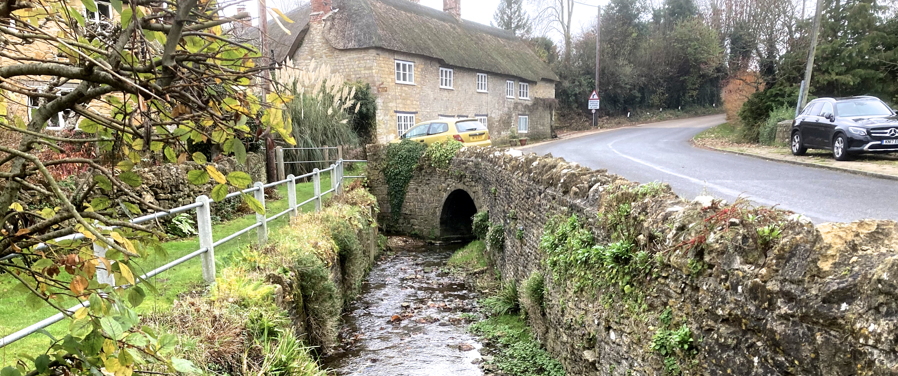
The Parrett as a small stream at South Perrot, just in Dorset. Phosphate concentration 0.16 ppm early in the year
Home - 2022 Data - Upper Parrett
| |
|
Sample data can be seen on the map below . Click any point.
This link does not work in some browsers. If you cant see a zoomable and clickable map, please follow this link (may not work with Safari) |
|
Comments
1 The phosphate concentration of the Parrett in this area varied from 0.2 ppm to 4.1 ppm over the year to September. The variation was due to both season and geography. The lowest was the headwater in South Perrott in spring and the highest at West Chinnock at the end of the August drought.
2 The main sources of the phosphate are Sewage Treatment Plants. None of the eleven feeding the river has aphosphate removal stage. By August all the drainage ditches feeding the river had dried up, leaving just a few streams from springs below the Yeovil scarplands to the east. All these springs were pristine but the river, fed almost entirely by the twelve sewage treatment plants draining into it, rose to unprecedented concentrations of phosphate at over 4ppm.
3 A considerable unprocessed overflow into Small Brook was noted on 3/2/22 and reported to the Environment Agency (EA). Small Brook is a tributary draining the area around Haselbury Plucknett. The EA reported that it was due to a leaking silage clamp at the large Arla dairy unit near Haselbury Plucknett. The brook was sampled again on 14/3/22 when considerable evidence of the leak could still be seen (link to a video on the right). Sewage fungus normally disappers quckly after the discharge is stopped. When the feeder ditch from the farm into Small Brook dried out in August, the fungus disappeared. This samples were taken at point D on the map where the long distance path, the Monarch's Way, crosses a footbridge.
4 The quantity of phosphate (in kg/day) flowing down the river remained remarkably constant through the year. The EA measures the river flow rate at Chiselborough and real time results are online. Despite a variation in concentration over the year from 1 to 4 ppm, the phosphate flow remained around 50kg/day. This issue is being investigated further in streams where flow rate is known (such as pumped drains) |
Links
Video link - Grey 'sewage fungus' (actually a bacterium) growing in Small Brook at the point where it is crossed by the Monarch's Way near Haselbury Plucknett.
Parret flow rates.
Follow this link to the EA real-time display of the flow under the A365 road bridge at Chiselborough. (Navigate to Chiselborough). Note how low the river has been since June
|
Last modified 24 Oct 22 |