Experimental
Home > Experimental
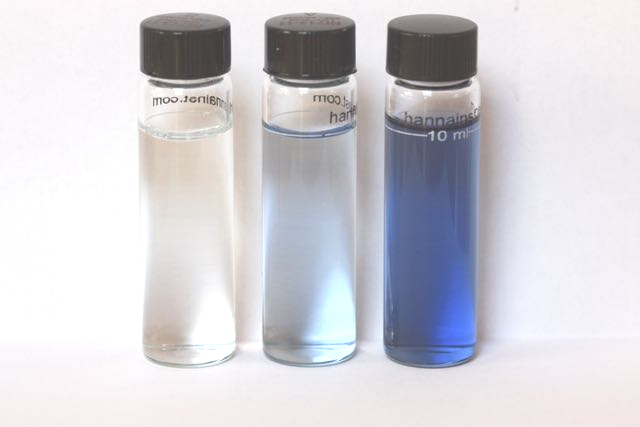
What phosphate is measured? Note that modern convention in the UK expresses the phosphorus concentration in water not in terms of the phosphate ion (ionic mass 95) which includes four oxygen atoms as well as phosphorus, but of phosphorus (atomic mass 31). This is frequently referred to a 'phosphorus as P' and results in a record of the concentration in ppm that is approximately one third of the phosphate value. The Environment Agency uses the 'Phosphors as P' convention in its routine river monitoring. The phosphate test The group of metallic elements known as transition metals are well known for producing intensely coloured compounds and these form the basis of the classical oil-paint colours and also of gemstones. Common examples of transition metals are iron, cobalt, nickel, silver and gold. The metal molybdenum is a less well known transition metal and its compounds can form, under the right conditions in solution, an intense blue substance with phosphate. The reagent used is ammonium molybdate which under adidic and reducing conditions forms phosphomolybdenum blue (right). The intensity of the blue colour is directly related to the concentration of the phosphate in the sample. It is quite possible to make an adequate assessment of the phosphate concentration by viewing the blue colour with the naked eye but this process is much better automated using a simple device called a colorimeter. A monochromatic light beam is directed through the solution and detected; the attenuation of the beam is measured and translated on the read-out screen calibrated directly as the concentration of phosphate in the original sample. The colorimeter is first calibrated using the test solution in an optical-standard glass vial without reagents. This establishes the baseline against which the colour intensity is measured. An excess amount of the molybdenum reagent pre-mixed with other chemicals (traditionally ascorbic acid but in this case potassium disulfate) is added to create the right environment (acidic and reducing). The vial is then shaken then to ensure the reagents are completely dissolved, and then left a further 3 minutes for the rection to complete before the second reading is taken. Units of phosphate concentration Sampling Filtering Variations in phosphate concentration within watercourses |
The colorimeter used gives a result accurate over most of its range to around ±4%. A number of different colorimeters are used and from time to time they are checked against each other. In turn some are checked aganst a standard. Survey scale categories used Note - the scale grades below are currently under review in the light of new evidence received. This review is likely to raise the category of about 20% of samples by one grade
This scale is adapted from recommendations of the UK Technical Advisory Group of the Water Framework Directive (Phosphorus Standards for Rivers, 2013) |
||
|---|---|---|---|
|
|||
Updated 13th June 23
|